Profit metrics: What gets measured, gets improved

Matt Byrne
Director
Summary
In last week’s post we discussed the seemingly unlimited amount of financial data available through cloud-based accounting software platforms like Xero and QuickBooks. We tackled the revenue metrics every business owner should be tracking.
However, the conversation about financial metrics doesn’t end with just revenue. This week we continue the discussion with profit metrics. As a business owner, you’re likely focused on growing your company and increasing profits. While there are many different factors that can affect your bottom line, tracking key profit metrics is an essential part of making sound business decisions. Despite knowing this many business owners don’t know what data to look at and how to translate it into practical and actionable advice.
Before we get into the specific metrics it’s worth noting that reporting on these metrics is only one part of the puzzle. The metrics merely highlight the high-level performance of the business but don’t really give the underlying reasons for that performance. It’s the WHY that is the really important piece and what you ultimately need to ask and understand.
What the metrics do is help you know what needs to be looked at in more detail. For example, let’s say you sell products and have a gross profit margin of 10% for a month and that’s below the target of 35%. That stat alone doesn’t give you much info except for the fact that you need to look into it. Digging down into the data will give you the reasons why you haven’t made as much money. In this example it could be something as simple as a reporting issue resulting in cost of sales not being reported in the correct month.
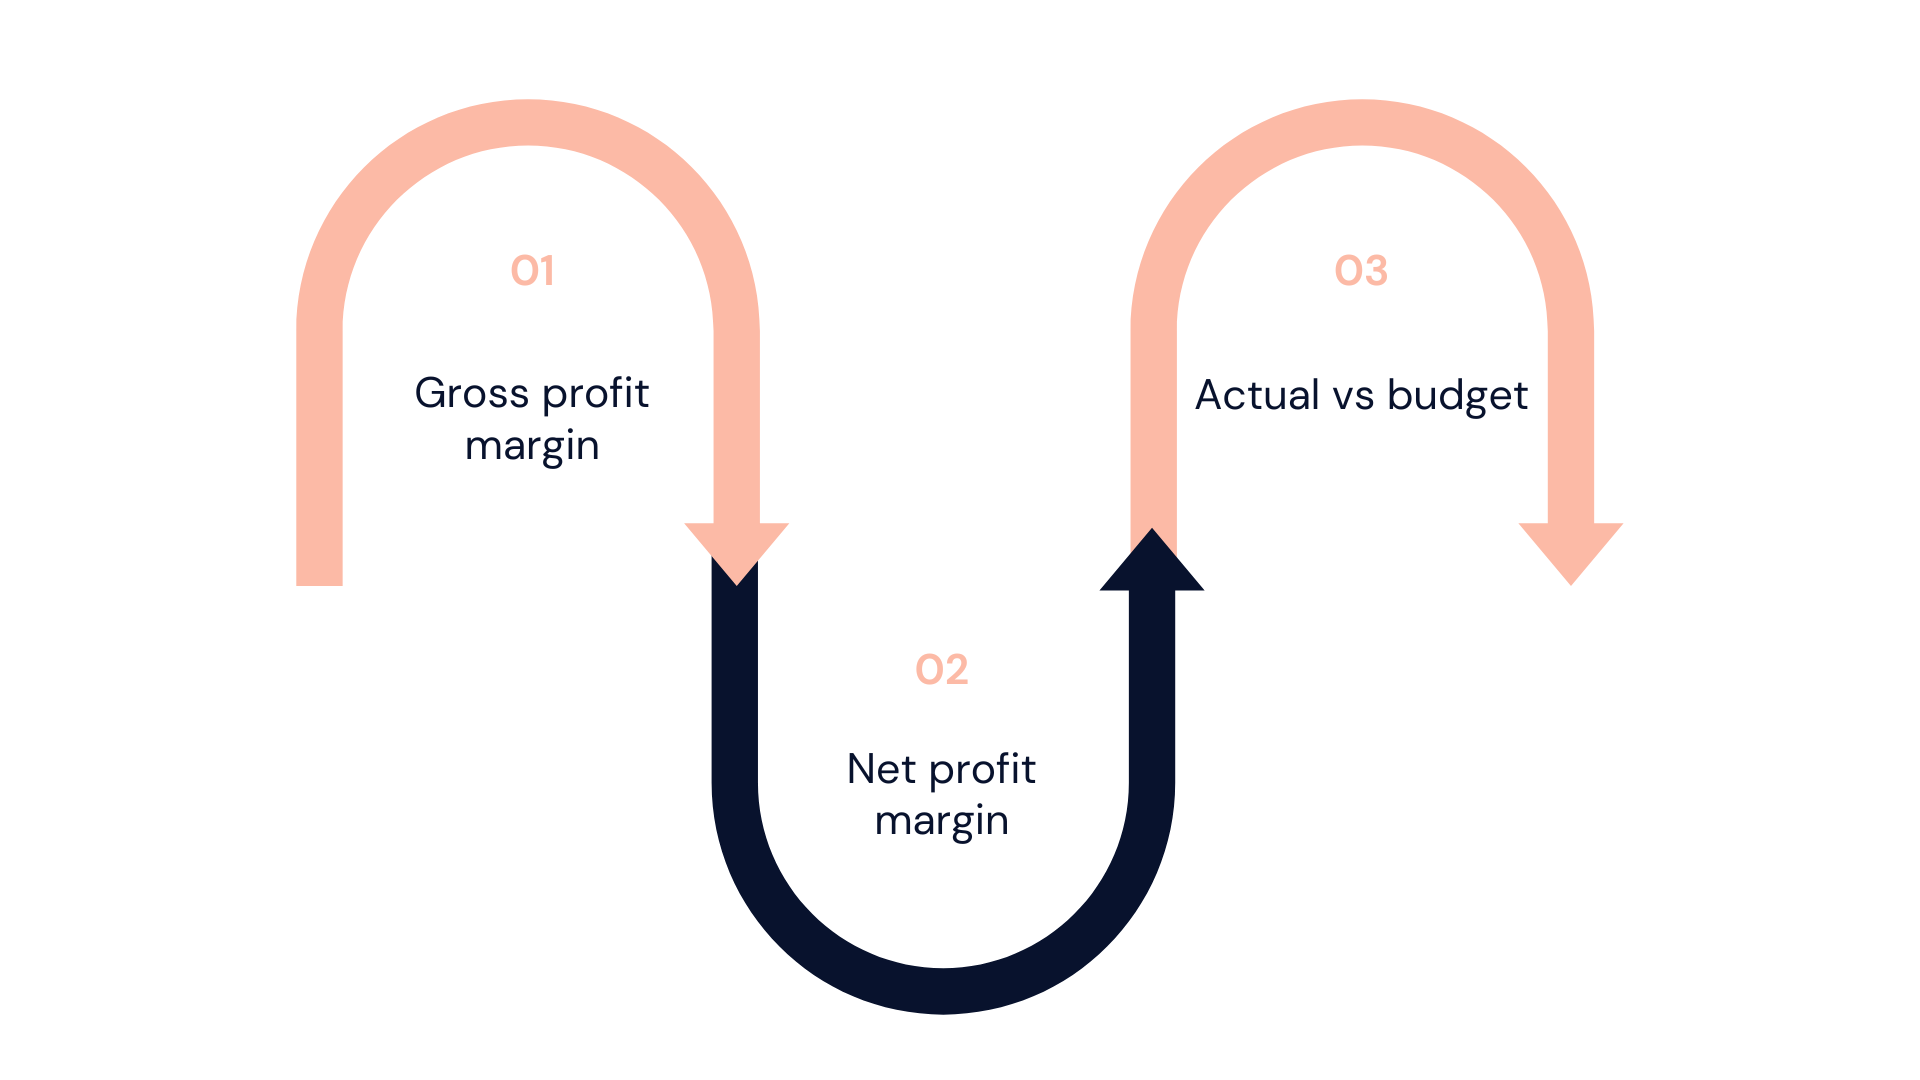
Now, let’s have a look at a few profit metrics we think you should be tracking and reporting on. These work for both service and product based businesses so this should apply to one and all.

Gross profit margin
In our opinion, this one is the most important for businesses to understand as it’s the gross profit that ultimately funds the operating expenses and impacts your net profit.
Let’s cover off on some basic terms:
Revenue
pretty simple, this is the money you make from selling your product or service.
Cost of goods sold
these are the costs that directly relate to producing the product your customers buy. If you manufacture a product, this is the cost of the components that go into making the product as well as any freight costs on those components. For service based businesses, this will be the labour costs for the people that perform the work. Cost of goods sold are often referred to as variable costs because the costs change with every product/service you provide. It doesn’t include fixed overheads like rent as these, while related, are not directly for the production of the product/service.
Gross profit
revenue minus cost of goods sold
How to calculate
The gross profit margin shows the gross profit as a percentage of revenue.
Gross profit margin = gross profit / revenue
Or you can show it as the full formula being:
Gross profit margin = (revenue – cost of goods sold) / revenue
Example
Assume Dannie sells dog collars and in November sells 1,000 dog collars at $20 each resulting in revenue of $20,000. For every collar she sells, it cost $7 to make and $3 to ship to the customer so the cost of sales is $10 per product and $10,000 for the November sales. Dannie’s gross profit is therefore $10,000 being $20,000 revenue minus $10,000 cost of sales.
To calculate the gross profit margin, Dannie divides the gross profit of $10,000 by the revenue of $20,000 which is a gross profit margin of 50%. We can express this in the formulas above:
Gross profit margin = (revenue of $20,000 – cost of sales of $10,000) / revenue of $20,000
= $10,000 gross profit / $20,000 revenue
= 50%
Why tracking gross profit margin is important
In short, this margin tells you how much you make per product or service you sell and let’s you calculate the number of products or services required to cover operating costs and make the required net profit (more on this below)↓.
Tracking your gross profit margin every month ensures you’re monitoring any changes in gross profit margin and allows you to find areas that you might be able to improve to increase your margin. For example, costs are currently going up on most things and if you’re not tracking your margins, your costs could be going up (and your margin going down) without you knowing. By tracking the margin you can see the additional costs and then implement changes to either increase your selling price or potentially shop around different suppliers to reduce costs.
When tracking your gross profit margin, we suggest you do this on a business wide basis as well as on a product-by-product or service-by-service basis. While a whole of business report is great, it lacks the actionable detail you need to ensure you’re maximising the margin across all aspects of your business.
As you saw from the above calculations, the gross profit margin is made up of your revenue and cost of sales so really, it’s just another reporting tool to help you track your revenue and expenses and ensure you’re getting the most from your business financially.
Gross profit margin vs markup
A common way for businesses to determine the selling price of their product is to take the cost of producing the product and adding a markup to arrive at the revenue. One common mix-up is confusing your markup with a margin. While these two things are both concerned with your gross profit, they are calculated differently and result in different figures.
Example
Let’s look at Dannie’s dog collar business again to illustrate this. Let’s say Dannie wants to make a gross profit margin of 50% on every collar she sells. We know from the above it costs $10 to produce a collar. If Dannie was to apply a markup of 50% to the $10 cost, she would get a selling price of $15 being $10 x (1 + markup % of 50%). However, if we then calculate the margin using the formula above, you can see that her gross profit margin is only 33% being (revenue of $15 – cost of sales of $10) / revenue of $15.
As you can see, the markup does not equal the margin so make sure you don’t get these two things confused.
How to calculate
Now, if you want to calculate the appropriate markup you need to make a particular margin you just need the following formula:
Target margin / (1 – target margin) = required markup
So in Dannie’s example, the markup for a margin of 50% is calculated as 50% / (1 – 50%) = 100%.
Net profit margin

The net profit margin is similar to the gross profit margin but unlike the gross profit margin, it includes all expenses. The net profit margin tells you how much profit you will make for every dollar of revenue you earn.
How to calculate
The net profit margin is calculated using the below formula:
Net profit margin = net profit / revenue
Or, expressed as the full formula:
Net profit margin = (revenue – costs of goods sold + other income – operating expenses) / revenue
The net profit margin is ultimately the biproduct of everything else you’ve done in your business and while it’s certainly worth tracking, it, in of itself, won’t give you much in the way of actionable insights. Instead, the net profit margin lets you track any changes and lets you know when something isn’t right and needs to be looked at further.
Actual vs budget

Reporting on your gross profit and net profit margins is one thing but without something to compare it to, you don’t have the full context. For example, if you had a gross profit margin of 30% for a month that might sound great in isolation, but if your target was 45% then 30% doesn’t look very good.
Tracking your actual gross profit and net profit margins against budget is a must do for all businesses. A budget is a financial target set for a business over a period of time (usually 12-months). A good budget is well researched with a detailed understanding of the drivers behind the numbers resulting in a realistic and achievable target. If you don’t have a budget, do one now!
The key in reporting actual vs budget is to dig down to understand why you had a variance to budget (that could be both a good or bad variance) and then determine what needs to be actioned to either improve your position or continue the good trajectory.
Every business is unique and reasons for budget vs actual variances will be entirely circumstantial. However, if you understand your numbers and the drivers in your business, you’ll be able to quickly draw a conclusion and implement changes.
Final Thoughts
The above are just some of the examples of financial metrics specific to your revenue. Ultimately the point of reporting on these metrics is to better understand the drivers in your business so you can make better, informed decisions.
If you need help with that exercise or just want a sounding board, reach out to the team at Day One Advisory.
